Implementing a Low-Pass Filter in Python
Low pass filter is a term in signal processing basics and is often used to filter signals to obtain more accurate results.
This tutorial will discuss the low-pass filter and how to create and implement it in Python.
A low-pass filter is used to pass signals with frequencies below a cutoff frequency, which is held at a certain value specified by the user. All signals with frequencies above the cutoff frequency are attenuated.
ScipyCreating a low-pass Butterworth filter
in Python using
In Python, we can SciPycreate a low pass filter using functions from the library. SciPyScientific Python is an abbreviation for Scientific Python, which is a library that provides functions for performing signal processing, optimization, and statistics. This library also uses the following NumPylibrary.
There are several low-pass filters that exist in the real world. However, we will create a Butterworth low-pass filter in Python because it has a maximum frequency of flatness, which means there are no ripples in the passband. This makes it one of the most popular and commonly used low-pass filters.
To successfully implement this method in Python, we first need to import the NumPy, SciPy, and Matplotlibmodules into our Python code.
SciPyThe following code creates a low-pass Butterworth filter in Python
using the module.
import numpy as np
from scipy.signal import butter, lfilter, freqz
import matplotlib.pyplot as plt
def butter_lowpass(cutoff, fs, order=5):
nyq = 0.5 * fs
normal_cutoff = cutoff / nyq
b, a = butter(order, normal_cutoff, btype="low", analog=False)
return b, a
def butter_lowpass_filter(data, cutoff, fs, order=5):
b, a = butter_lowpass(cutoff, fs, order=order)
y = lfilter(b, a, data)
return y
# Setting standard filter requirements.
order = 6
fs = 30.0
cutoff = 3.667
b, a = butter_lowpass(cutoff, fs, order)
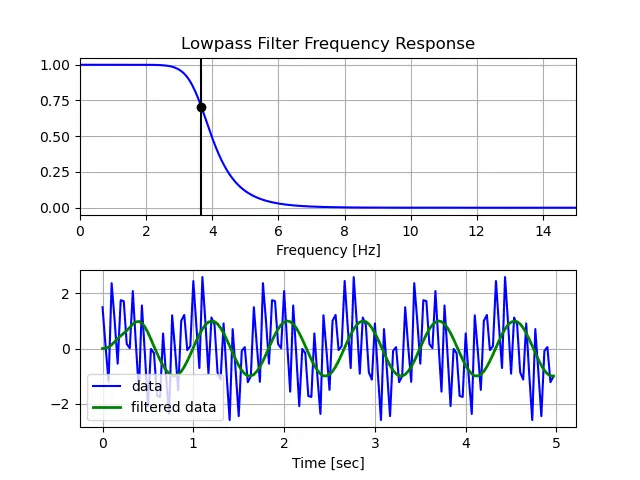
# Plotting the frequency response.
w, h = freqz(b, a, worN=8000)
plt.subplot(2, 1, 1)
plt.plot(0.5 * fs * w / np.pi, np.abs(h), "b")
plt.plot(cutoff, 0.5 * np.sqrt(2), "ko")
plt.axvline(cutoff, color="k")
plt.xlim(0, 0.5 * fs)
plt.title("Lowpass Filter Frequency Response")
plt.xlabel("Frequency [Hz]")
plt.grid()
# Creating the data for filteration
T = 5.0 # value taken in seconds
n = int(T * fs) # indicates total samples
t = np.linspace(0, T, n, endpoint=False)
data = (
np.sin(1.2 * 2 * np.pi * t)
+ 1.5 * np.cos(9 * 2 * np.pi * t)
+ 0.5 * np.sin(12.0 * 2 * np.pi * t)
)
# Filtering and plotting
y = butter_lowpass_filter(data, cutoff, fs, order)
plt.subplot(2, 1, 2)
plt.plot(t, data, "b-", label="data")
plt.plot(t, y, "g-", linewidth=2, label="filtered data")
plt.xlabel("Time [sec]")
plt.grid()
plt.legend()
plt.subplots_adjust(hspace=0.35)
plt.show()
For reprinting, please send an email to 1244347461@qq.com for approval. After obtaining the author's consent, kindly include the source as a link.
Related Articles
Pretty Printing Dictionaries in Python
Publish Date:2025/05/07 Views:126 Category:Python
-
This tutorial will show you how to pretty print dictionaries in Python. Pretty printing means presenting some printed content in a more readable format or style. pprint() Pretty printing dictionaries in Python pprint is a Python module that
Writing logs to a file in Python
Publish Date:2025/05/06 Views:133 Category:Python
-
This tutorial will show you how to write logs to files in Python. Use the module in Python logging to write logs to files Logging is used to debug a program and find out what went wrong. logging The log module is used to log data to a file
Comparing two dates in Python
Publish Date:2025/05/06 Views:97 Category:Python
-
This tutorial explains how to compare two dates in Python. There are multiple ways to determine which date is greater, so the tutorial also lists different sample codes to illustrate the different methods. Comparing two dates in Python usin
Reload or unimport modules in Python
Publish Date:2025/05/06 Views:59 Category:Python
-
Modules allow us to store definitions of different functions and classes in Python files, which can then be used in other files. pandas , NumPy , scipy , Matplotlib are the most widely used modules in Python. We can also create our own modu
Pausing program execution in Python
Publish Date:2025/05/06 Views:157 Category:Python
-
This tutorial will demonstrate various ways to pause a program in Python. Pausing the execution of a program or application is used in different scenarios, such as when a program requires user input. We may also need to pause the program fo
Importing modules from a subdirectory in Python
Publish Date:2025/05/06 Views:191 Category:Python
-
This tutorial will explain various ways to import modules from subdirectories in Python. Suppose we have a file in a subdirectory of our project directory and we want to import this file and use its methods in our code. We can import files
Sleeping for a number of milliseconds in Python
Publish Date:2025/05/06 Views:124 Category:Python
-
In this tutorial, we will look at various ways to pause or suspend the execution of a program in Python for a given amount of time. Let's say we want to pause the execution of a program for a few seconds to let the user read instructions ab
Python Numpy.pad Function
Publish Date:2025/05/06 Views:104 Category:Python
-
In Python, we have NumPy the array module to create and use arrays. Arrays can have different sizes and dimensions. Padding is a useful method that can be used to compensate for the size of an array. We can mutate an array and add some padd
Generating Random Colors in Python
Publish Date:2025/05/06 Views:136 Category:Python
-
In the digital world, colors are represented in different formats. RGB, Hexadecimal format are just some of the commonly used formats. In this tutorial, we will learn how to generate random colors in Python. When we talk about generating ra

