R 中的 scale_y_continuous 函数
本文将介绍 R 中的 scale_y_continuous 函数。
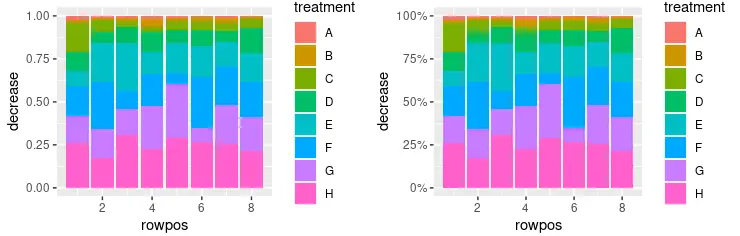
使用 scale_y_continuous 将 Y 轴标签打印为 R 中的百分比
scale_y_continuous 用于设置连续 y 轴比例美学的值。该函数是 ggplot2 包的一部分,它主要与 ggplot 对象一起使用来修改要绘制的图形的不同参数。此示例演示如何使用 scale_y_continuous 将 Y 轴标签打印为百分比值。请注意,堆叠条形图是使用 geom_col(position = "fill") 函数调用创建的,百分比是使用 scales::percent 函数作为 labels 参数值打印的。由于我们使用 library 调用包含了 scales 包,因此可以在此脚本的范围内使用 percent 表示法引用它。
library(ggplot2)
library(gridExtra)
library(scales)

p1 <- ggplot(OrchardSprays, aes(x = rowpos, y = decrease, fill = treatment)) +
  geom_col(position = "fill")

p2 <- ggplot(OrchardSprays, aes(x = rowpos, y = decrease, fill = treatment)) +
  geom_col(position = "fill") +
  scale_y_continuous(labels = percent)

grid.arrange(p1, p2, ncol = 2, nrow =2)
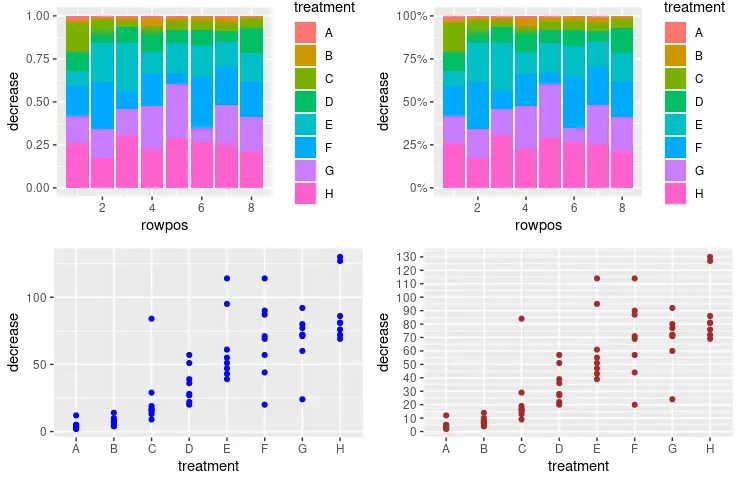
使用 scale_y_continuous 设置 R 中 Y 轴的缩放比例
还可以利用 scale_y_continuous 设置 y 轴比例和增量值以打印下一个标签。seq 函数用于将数字序列传递给 scale_y_continuous 调用中的 breaks 参数。它将数字解释为 seq(from, to, by= ) 表示。
library(ggplot2)
library(gridExtra)
library(scales)

p1 <- ggplot(OrchardSprays, aes(x = rowpos, y = decrease, fill = treatment)) +
  geom_col(position = "fill")

p2 <- ggplot(OrchardSprays, aes(x = rowpos, y = decrease, fill = treatment)) +
  geom_col(position = "fill") +
  scale_y_continuous(labels = percent)

p3 <- ggplot(OrchardSprays, aes(x = treatment, y = decrease)) +
  geom_point(colour = "blue")

p4 <- ggplot(OrchardSprays, aes(x = treatment, y = decrease)) +
  geom_point(colour = "brown") +
  scale_y_continuous(breaks = seq(0, 150, 10))

grid.arrange(p1, p2, p3, p4, ncol = 2, nrow =2)
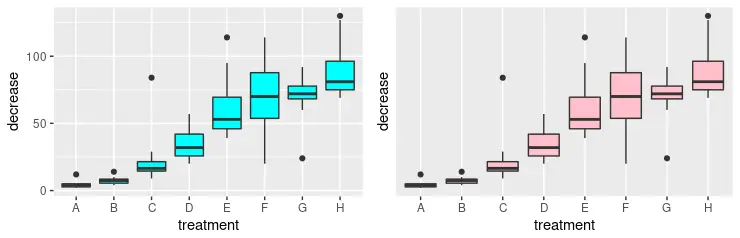
使用 scale_y_continuous 删除 R 中 Y 轴上的标签
或者,我们可以使用 scale_y_continuous 函数完全删除 y 轴上的标签。为此,我们需要将 NULL 值作为 breaks 参数传递。请注意,我们绘制了两个图形与 grid.arrange 函数进行视觉比较。
library(ggplot2)
library(gridExtra)

p3 <- ggplot(OrchardSprays, aes(x = treatment, y = decrease)) +
  geom_boxplot(fill = "cyan")

p4 <- ggplot(OrchardSprays, aes(x = treatment, y = decrease)) +
  geom_boxplot(fill = "pink") +
  scale_y_continuous(breaks = NULL)

grid.arrange(p3, p4, ncol = 2, nrow =2)
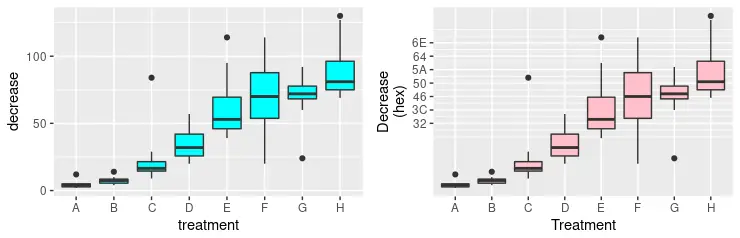
在 R 中使用 scale_y_continuous 使用自定义值修改 Y 轴标签
可以混合之前的一些方法以形成更高级的 y 轴美学格式。在以下代码片段中,我们明确指定要打印的多个标签,并同时使用 labels 参数为它们定义新值。请注意,新值只是相应数字的十六进制数字符号。最后,我们使用给定的字符串和 x 轴重命名 y 轴比例,这是使用 scale_x_discrete 函数完成的。
library(ggplot2)
library(gridExtra)

p3 <- ggplot(OrchardSprays, aes(x = treatment, y = decrease)) +
  geom_boxplot(fill = "cyan")

p4 <- ggplot(OrchardSprays, aes(x = treatment, y = decrease)) +
  geom_boxplot(fill = "pink") +
  scale_y_continuous(
    breaks = c(50, 60, 70, 80, 90, 100, 110),
    labels = c("32", "3C", "46", "50", "5A", "64", "6E"),
    name = "Decrease\n(hex)") +
  scale_x_discrete(name = "Treatment")

grid.arrange(p3, p4, ncol = 2, nrow =2)
相关文章
R 中具有多个条件的函数向量化
发布时间:2023/03/21 浏览次数:72 分类:编程语言
-
一项常见的数据分析任务是根据同一行的其他列使用一个或多个条件创建或更新数据框列。 如果我们尝试使用 if 语句来执行此操作,则只会使用第一行来测试条件,并且会根据该行更
在 R 中读取 xlsx 文件
发布时间:2023/03/21 浏览次数:198 分类:编程语言
-
在这篇文章中,你将会了解到两个在 R 中读取 xlsx 文件的最完整和最容易使用的库:readxl 和 openxlsx。

