R 中的 scale_x_discrete 函数
本文将介绍 R 中的 scale_x_discrete 函数。
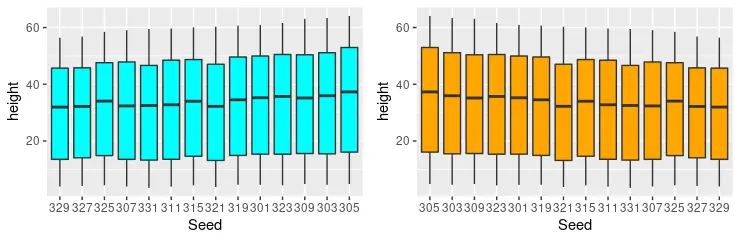
使用 scale_x_discrete 反转 R 图中 x 轴上的元素顺序
scale_x_discrete 用于设置离散 x 轴比例美学的值。在本文中,我们使用 ggplot 和 geom_boxplot 函数构建多个箱线图来演示 scale_x_discrete 中不同参数的效果。通常情况下,轴上元素的顺序需要颠倒,实现这一点最简单的方法是将 scale_x_discrete 参数的 limits 参数设置为 rev(levels(dataset_name$X_axis_items))。请注意,数据集名称首先出现,然后是 $ 符号,然后我们指定需要反转的 x 轴数据。
library(ggplot2)
library(gridExtra)

p1 <- ggplot(Loblolly, aes(x = Seed, y = height)) +
  geom_boxplot(fill = "cyan")

p2 <- ggplot(Loblolly, aes(x = Seed, y = height)) +
  geom_boxplot(fill = "orange") +
  scale_x_discrete(limits = rev(levels(Loblolly$Seed)))

grid.arrange(p1, p2, ncol = 2, nrow =2)
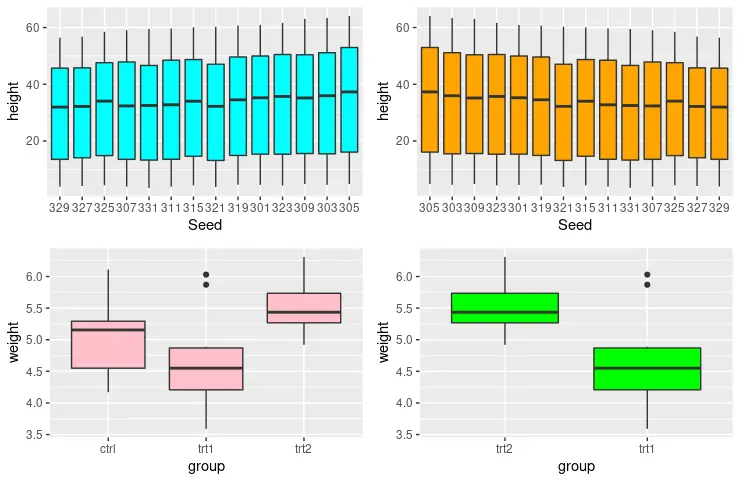
在 R 中使用 scale_x_discrete 的 x 轴上显示元素的子集
scale_x_discrete 函数的另一个有用功能是从 x 轴消除一些元素并仅绘制其中的少数元素。在这种情况下,我们使用 PlantGrowth 数据集,其中列出了三类组。因此,我们可以输出只有 trt2 和 trt1 组的箱线图,如下面的代码片段所示。
library(ggplot2)
library(gridExtra)

p1 <- ggplot(Loblolly, aes(x = Seed, y = height)) +
  geom_boxplot(fill = "cyan")

p2 <- ggplot(Loblolly, aes(x = Seed, y = height)) +
  geom_boxplot(fill = "orange") +
  scale_x_discrete(limits = rev(levels(Loblolly$Seed)))

p3 <- ggplot(PlantGrowth, aes(x = group, y = weight)) +
  geom_boxplot(fill = "pink")

p4 <- ggplot(PlantGrowth, aes(x = group, y = weight)) +
  geom_boxplot(fill = "green") +
  scale_x_discrete(limits = c("trt2", "trt1"))

grid.arrange(p1, p2, p3, p4, ncol = 2, nrow =2)
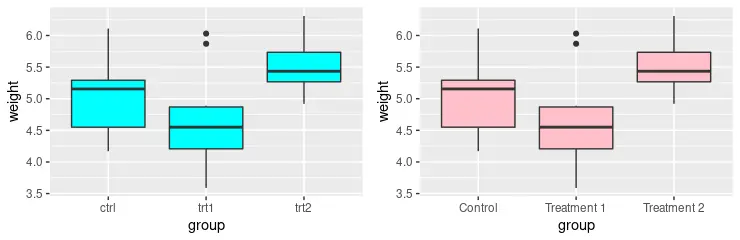
使用 scale_x_discrete 重命名 R 中 x 轴上的元素标签
scale_x_discrete 函数还可用于沿 x 轴重命名元素标签。新标签值可以与分配给 scale_x_discrete 函数中的 labels 参数的向量一起提供。
library(ggplot2)
library(gridExtra)

p1 <- ggplot(PlantGrowth, aes(x = group, y = weight)) +
  geom_boxplot(fill = "cyan")

p2 <- ggplot(PlantGrowth, aes(x = group, y = weight)) +
  geom_boxplot(fill = "pink") +
  scale_x_discrete(
    labels = c("Control", "Treatment 1", "Treatment 2")
  )

grid.arrange(p1, p2, ncol = 2, nrow =2)
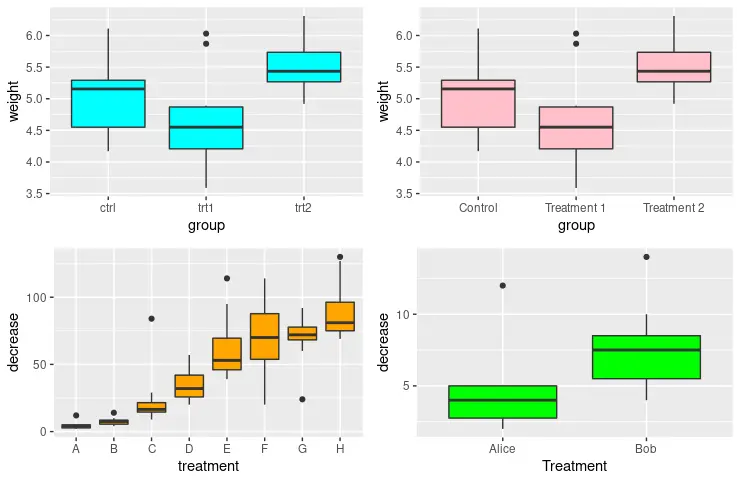
使用 scale_x_discrete 修改 R 中的 x 轴名称
请注意,前面的每个方法都可以组合以输出所需的图形结构。例如,以下示例代码绘制 p4 以仅显示元素的子集,并使用提供的值重命名这些标签。此外,我们利用 scale_x_discrete 使用 name 参数沿 x 轴修改名称。
library(ggplot2)
library(gridExtra)

p1 <- ggplot(PlantGrowth, aes(x = group, y = weight)) +
  geom_boxplot(fill = "cyan")

p2 <- ggplot(PlantGrowth, aes(x = group, y = weight)) +
  geom_boxplot(fill = "pink") +
  scale_x_discrete(
    labels = c("Control", "Treatment 1", "Treatment 2")
  )

p3 <- ggplot(OrchardSprays, aes(x = treatment, y = decrease)) +
  geom_boxplot(fill = "orange")

p4 <- ggplot(OrchardSprays, aes(x = treatment, y = decrease)) +
  geom_boxplot(fill = "green") +
  scale_x_discrete(
    limits = c("A", "B"),
    labels = c("Alice", "Bob"),
    name = "Treatment"
  )

grid.arrange(p1, p2, p3, p4, ncol = 2, nrow =2)
相关文章
R 中具有多个条件的函数向量化
发布时间:2023/03/21 浏览次数:72 分类:编程语言
-
一项常见的数据分析任务是根据同一行的其他列使用一个或多个条件创建或更新数据框列。 如果我们尝试使用 if 语句来执行此操作,则只会使用第一行来测试条件,并且会根据该行更
在 R 中读取 xlsx 文件
发布时间:2023/03/21 浏览次数:198 分类:编程语言
-
在这篇文章中,你将会了解到两个在 R 中读取 xlsx 文件的最完整和最容易使用的库:readxl 和 openxlsx。

