Exponential and Logarithmic Curve Fitting in Python
Curve fitting is a very effective tool that is widely used in analysis. Curve fitting method studies the relationship between independent variables (also called predictor variables) and dependent variable (called response variable). This method aims to provide the best fit model to fit a certain number of data points.
There are two types of curve fitting:
- Logarithmic Curve Fitting
- Exponential curve fitting
In this tutorial, we will show you how to perform logarithmic curve fitting and exponential curve fitting in Python.
Libraries and modules for logarithmic and exponential curve fitting in Python
Let us discuss the possible libraries and modules that can be used to execute the program.
NumPy library
We will use NumPythe functions from the library as follows.
-
array()- This function is used to create anNumPyarray, which is a set of values of the same type with index values in the form of a tuple. -
log()- This function is more like a mathematical operation that helps calculate the natural logarithm of a number that is a part of the input array elements. -
exp()- This function is also a mathematical operation which calculatesNumPythe exponential of the elements present in the input array. -
polyfit()- This function helps to fit any data in a polynomial function. It performs least squares on the polynomial fit.
Matplotlib Library
MatplotlibThe library is mainly used for plotting in Python. This library is commonly used to create visualizations in Python. In this tutorial, a module from this library is used, called pyplotmodule.
MatplotlibThe library's MATLAB pyplotmodule is an open source module that helps make Matplotlibthe library work like MATLAB. This module has many functions that help us to create plot areas, create labels on plots, etc.
Logarithmic Curve Fitting
As the name suggests, a logarithmic equation is plotted here. Let’s jump directly to the code where we will do the logarithmic curve fitting in Python.
import numpy as np

x = np.array([5, 10, 15, 20, 25])
y = np.array([3, 6, 9, 12, 15])

log_x = np.log(x)
log_y = np.log(y)

coefficients = np.polyfit(log_x, y, 1)
print(coefficients)
Output:
[ 7.2647162 -9.64806344]
For drawing, follow this procedure.
import matplotlib.pyplot as plt

c = 7.26 * log_x - 9.64
plt.plot(log_x, y, "o")
plt.plot(log_x, c)
Output:
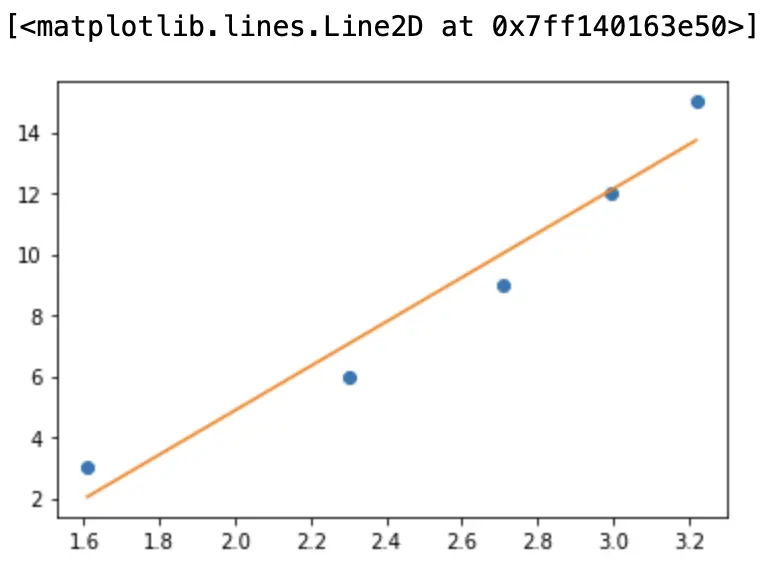
In the above program, we first import the necessary libraries. After that, we create two NumPyarrays as our main data. Then, we calculate the logarithmic values of the elements in both arrays. We use polyfit()the function for the logarithmic values of the xand yarrays. Using polyfit()the function, the coefficient of the logarithmic equation is returned.
- After obtaining the coefficients, we use these coefficients in the logarithmic equation to plot the curve.
-
Finally, we draw the graph using the function of the module
Matplotlibof the library .pyplotplot()
Exponential curve fitting
As the name suggests, an exponential equation is plotted here. Let’s jump directly to the code where we will do exponential curve fitting in Python.
import numpy as np

a = np.array([6, 12, 18, 24, 30])
b = np.array([4, 8, 12, 16, 20])

log_a = np.log(a)
log_b = np.log(b)

coefficients = np.polyfit(a, log_b, 1)
print(coefficients)
Output:
[0.06520038 1.17018581]
For plotting, here is the code snippet you can follow.
c = np.exp(1.17) * np.exp(0.06 * a)
plt.plot(a, b, "o")
plt.plot(a, c)
Output:
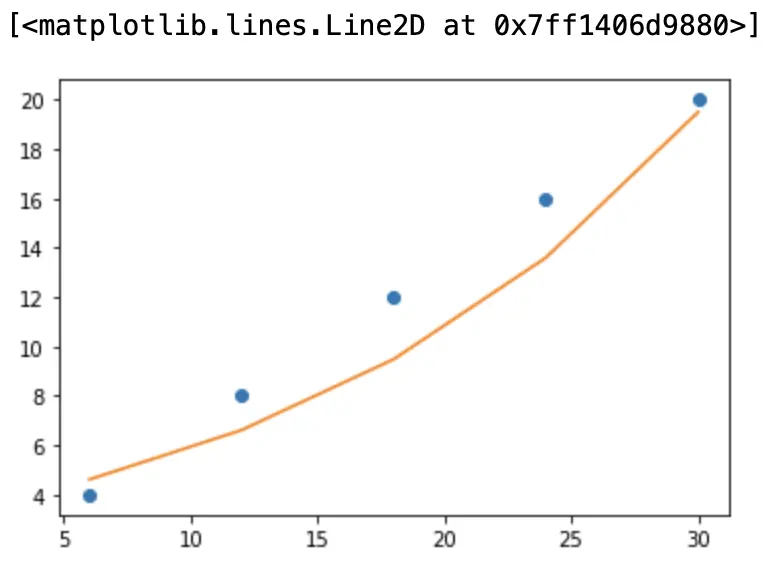
Follow the same process as we did in logarithmic curve fitting. But here, an exponential function is used instead of logarithmic function. So, polyfit()the coefficients returned by the function are passed in the exponential function equation.
For reprinting, please send an email to 1244347461@qq.com for approval. After obtaining the author's consent, kindly include the source as a link.
Related Articles
Read the first line of a file in Python
Publish Date:2025/05/05 Views:192 Category:Python
-
In Python, we have built-in functions to handle different file operations. A text file contains a sequence of strings where each line \n is terminated by a newline character. In this tutorial, we will learn how to read the first line of a t
Calculating Slope in Python
Publish Date:2025/05/05 Views:60 Category:Python
-
In mathematics, the slope of a given line is the value at which its steepness is calculated. It also helps to characterize the direction of a given line. The extent of a line can also be calculated using Python programming language. This ar
How to Randomly Select Elements from a List in Python
Publish Date:2025/05/05 Views:68 Category:Python
-
This tutorial showed you how to randomly select an element from a list in Python. There are multiple simple ways to achieve this goal, all of which involve importing Python modules. This tutorial will cover solutions that require the random
How to Replace an Element in a Python List
Publish Date:2025/05/05 Views:109 Category:Python
-
We can replace elements in Python lists in many ways. We can use Python list element indexing, for loops, map functions, and list comprehensions. This article will discuss the above methods to find and replace elements in Python lists. Sear
Convert Tensor to NumPy array in Python
Publish Date:2025/05/03 Views:86 Category:Python
-
This tutorial will show you how to convert a Tensor to a NumPy array in Python. Use the function in Python Tensor.numpy() to convert a tensor to a NumPy array Eager Execution of TensorFlow library can be used to convert tensor to NumPy arra
Saving NumPy arrays as images in Python
Publish Date:2025/05/03 Views:194 Category:Python
-
In Python, numpy module is used to manipulate arrays. There are many modules available in Python that allow us to read and store images. An image can be thought of as an array of different pixels stored at specific locations with correspond
Transposing a 1D array in NumPy
Publish Date:2025/05/03 Views:98 Category:Python
-
Arrays and matrices form the core of this Python library. The transpose of these arrays and matrices plays a vital role in certain topics such as machine learning. In NumPy, it is easy to calculate the transpose of an array or a matrix. Tra
Find the first index of an element in a NumPy array
Publish Date:2025/05/03 Views:59 Category:Python
-
In this tutorial, we will discuss how to find the first index of an element in a numpy array. Use where() the function to find the first index of an element in a NumPy array The function in the numpy module where() is used to return an arra
Remove Nan values from NumPy array
Publish Date:2025/05/03 Views:119 Category:Python
-
This article discusses some built-in NumPy functions that you can use to remove nan values. Remove Nan values using logical_not() and methods in NumPy isnan() logical_not() is used to apply logical NOT to the elements of an array. isn

