如何在 ggplot2 R 图中设置轴的范围
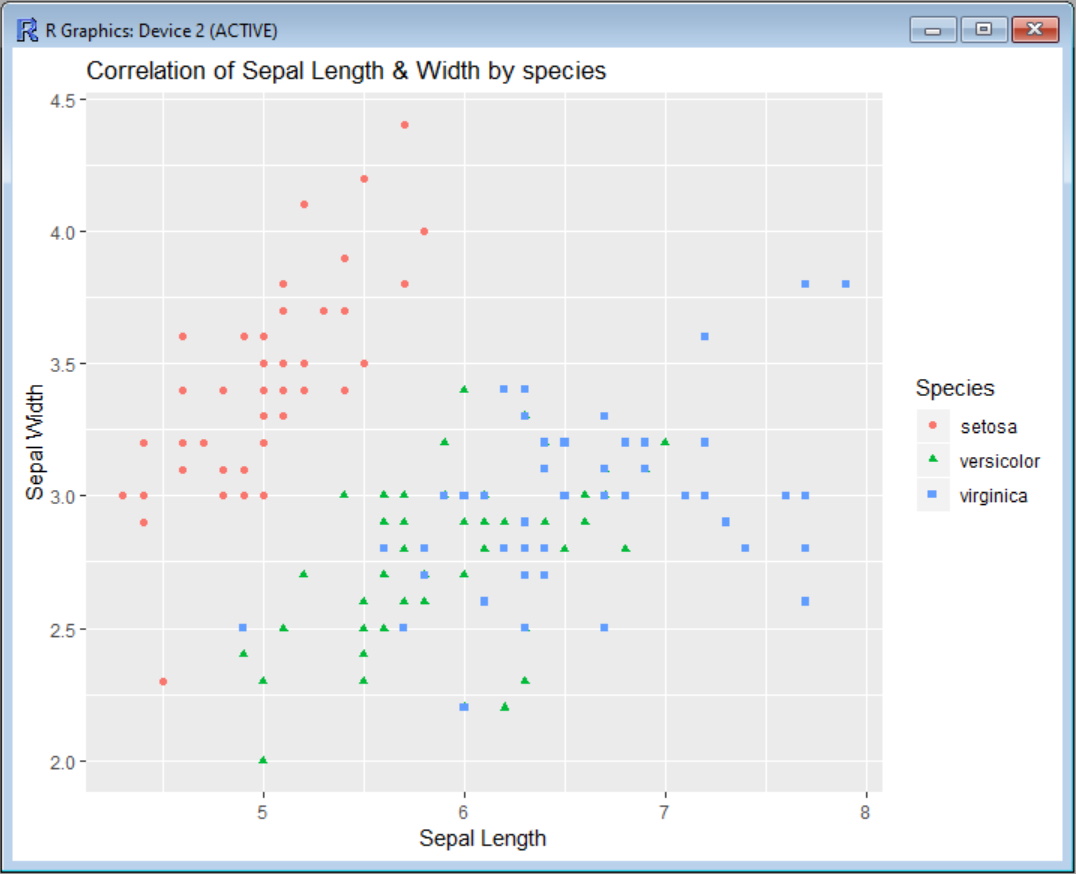
首先让我们看一下我们的散点图,不对轴施加任何限制。在这个例子中,我们使用 Iris 数据集来关联萼片宽度值和萼片宽度,按颜色对物种进行分类。在调用 ggplot 函数之前,我们需要安装 ggplot2 包,并加载相应的库。
install.packages("ggplot2")
library(ggplot2)
scatter <- ggplot(data=iris, aes(x = Sepal.Length, y = Sepal.Width))
scatter + geom_point(aes(color=Species, shape=Species)) +
 ylab("Sepal Width") + xlab("Sepal Length") +
 ggtitle("Correlation of Sepal Length & Width by species")
输出:
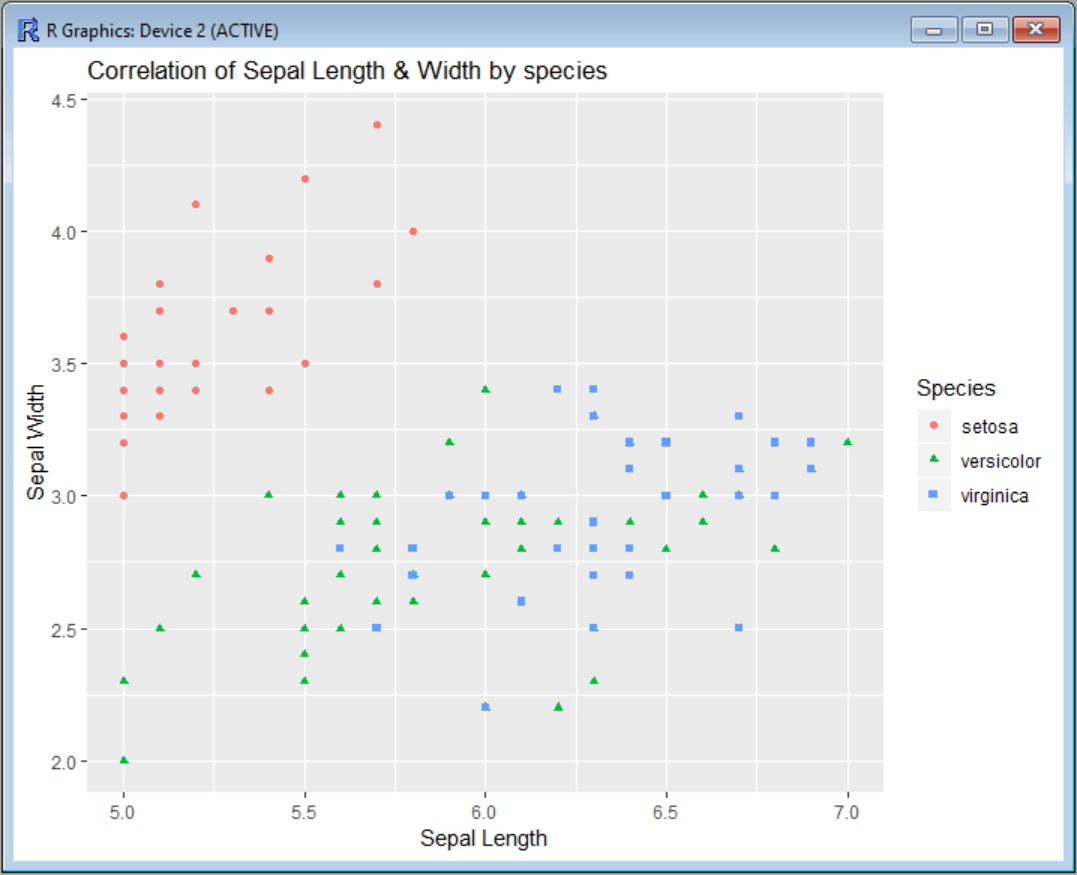
现在,假设我们想限制 x 轴(萼片长度),使图形只显示 x=5 和 x=7 之间的区域。我们有两个选择:使用 scale_x_continuous 或使用 coord_cartesian。
scale_x_continuous 删除所有落在给定轴指定范围外的数据点,而 coord_cartesian 只调整可见区域。在大多数情况下,这两个选项会呈现相同的结果。但如果你碰巧对数据进行了一些拟合,那么拟合的值可能会改变。
用 ggplot2 中的 scale_x_continuous 设置 x 轴的限制
要使用 scale_x_continuous,你需要指定一个 X 轴的下限和上限的向量,像这样。
scatter <- ggplot(data=iris, aes(x = Sepal.Length, y = Sepal.Width))
scatter + geom_point(aes(color=Species, shape=Species)) +
 ylab("Sepal Width") + xlab("Sepal Length") +
 ggtitle("Correlation of Sepal Length & Width by species") +
 scale_x_continuous(limits = c(5, 7))
输出:
我们还会收到一条警告信息,告诉你有多少数据点被从图形中删除。
Warning message:
Removed 34 rows containing missing values (geom_point).
如果我们也想限制 Y 轴,可以用同样的方法添加 scale_y_continuous,就像这个例子。
scatter <- ggplot(data=iris, aes(x = Sepal.Length, y = Sepal.Width))
scatter + geom_point(aes(color=Species, shape=Species)) +
ylab("Sepal Width") + xlab("Sepal Length") +
ggtitle("Correlation of Sepal Length & Width by species") +
scale_x_continuous(limits = c(5, 7)) +
scale_y_continuous(limits = c(2.5, 4))
输出将显示两个轴的范围限制。

你也可以使用速记函数 xlim 和 ylim 代替 scale_x_continuous 和 scale_y_continuous 来使命令更短一些。
scatter <- ggplot(data=iris, aes(x = Sepal.Length, y = Sepal.Width))
scatter + geom_point(aes(color=Species, shape=Species)) +
  ylab("Sepal Width") + xlab("Sepal Length") +
  ggtitle("Correlation of Sepal Length & Width by species") +
  xlim(5, 7) + ylim(2.5, 4)
使用 coord_cartesian 来限制 ggplot2 中的两个轴
如果你想用 coord_cartesian 代替 scale_x_continuous 和 scale_y_continuous,命令将是这样的。
scatter <- ggplot(data=iris, aes(x = Sepal.Length, y = Sepal.Width))
scatter + geom_point(aes(color=Species, shape=Species)) +
 ylab("Sepal Width") + xlab("Sepal Length") +
 ggtitle("Correlation of Sepal Length & Width by species") +
 coord_cartesian(xlim = c(5, 7), ylim = c(2.5, 4))
而且图形输出也是一样的。
在 RStudio ggplot2 的攻略中,你可以找到该命令所有选项的使用说明。
相关文章
R 中具有多个条件的函数向量化
发布时间:2023/03/21 浏览次数:72 分类:编程语言
-
一项常见的数据分析任务是根据同一行的其他列使用一个或多个条件创建或更新数据框列。 如果我们尝试使用 if 语句来执行此操作,则只会使用第一行来测试条件,并且会根据该行更
在 R 中读取 xlsx 文件
发布时间:2023/03/21 浏览次数:198 分类:编程语言
-
在这篇文章中,你将会了解到两个在 R 中读取 xlsx 文件的最完整和最容易使用的库:readxl 和 openxlsx。

