在 R 中使用 ggplot 创建自定义图例
本文将演示在 R 中使用 ggplot 创建自定义图例的多种方法。
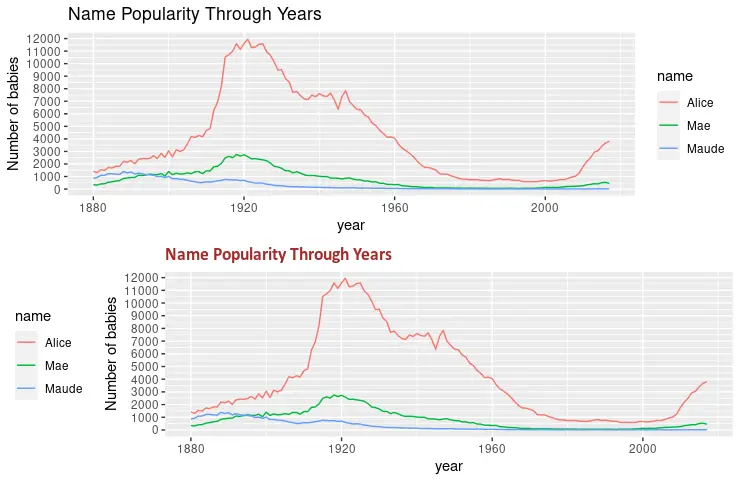
使用 theme 函数中的 legend.position 参数指定 R 中的图例位置
legend.position 参数指定图中的图例位置。可选值可以是 "none"、"left"、"right"、"bottom"、"top" 或二元素数值向量。plot.title 参数在以下示例中也用于修改绘图的标题。最后,使用 grid.arrange 函数同时绘制两个图。
library(ggplot2)
library(gridExtra)
library(babynames)
library(dplyr)

dat <- babynames %>%
  filter(name %in% c("Alice", "Maude", "Mae")) %>%
  filter(sex=="F")

p1 <- ggplot(dat, aes(x = year, y = n, color = name)) +
  geom_line() +
  scale_y_continuous(
    breaks = seq(0, 15000, 1000),
    name = "Number of babies") +
  ggtitle("Name Popularity Through Years")

p2 <- ggplot(dat, aes(x = year, y = n, color = name)) +
  geom_line() +
  scale_y_continuous(
    breaks = seq(0, 15000, 1000),
    name = "Number of babies") +
  theme(
    legend.position = "left",
    plot.title = element_text(
      size = rel(1.2), lineheight = .9,
      family = "Calibri", face = "bold", colour = "brown"
    )) +
  ggtitle("Name Popularity Through Years")

grid.arrange(p1, p2, nrow = 2)
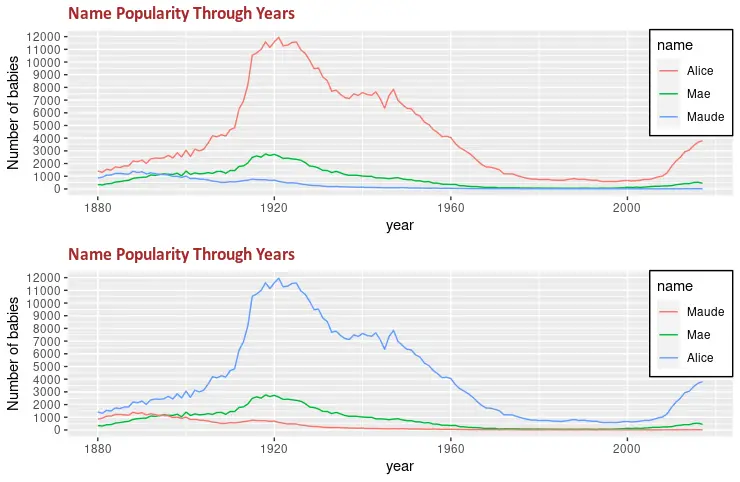
在 theme 函数中使用 legend.justification 和 legend.background 参数来创建自定义图例
theme 函数的另一个有用参数是 legend.background,可用于设置图例背景的格式。下面的代码片段用白色和黑色描边填充图例矩形。此外,legend.justification 与 legend.position 结合以指定图例的位置。
library(ggplot2)
library(gridExtra)
library(babynames)
library(dplyr)

dat <- babynames %>%
  filter(name %in% c("Alice", "Maude", "Mae")) %>%
  filter(sex=="F")

p3 <- ggplot(dat, aes(x = year, y = n, color = name)) +
  geom_line() +
  scale_y_continuous(
    breaks = seq(0, 15000, 1000),
    name = "Number of babies") +
  theme(
    legend.position = c(1, 1),
    legend.justification = c(1, 1),
    legend.background = element_rect(fill = "white", colour = "black"),
    plot.title = element_text(
      size = rel(1.2), lineheight = .9,
      family = "Calibri", face = "bold", colour = "brown"
    )) +
  ggtitle("Name Popularity Through Years")


p4 <- ggplot(dat, aes(x = year, y = n, color = name)) +
  geom_line() +
  scale_color_discrete(limits = c("Maude", "Mae", "Alice")) +
  scale_y_continuous(
    breaks = seq(0, 15000, 1000),
    name = "Number of babies") +
  theme(
    legend.position = c(1, 1),
    legend.justification = c(1, 1),
    legend.background = element_rect(fill = "white", colour = "black"),
    plot.title = element_text(
      size = rel(1.2), lineheight = .9,
      family = "Calibri", face = "bold", colour = "brown"
    )) +
  ggtitle("Name Popularity Through Years")

grid.arrange(p3, p4, nrow = 2)
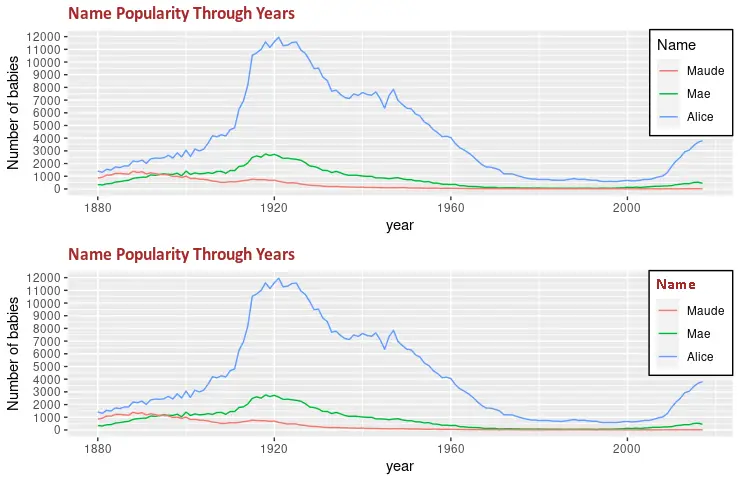
使用 theme 函数中的 legend.title 参数修改图例标题格式
legend.title 参数可用于更改图例标题格式。它需要带有不同参数的 element_text 函数来修改字体系列、文本颜色或字体大小等格式。grid.arrange 函数用于演示两个绘制图形之间的变化。
library(ggplot2)
library(gridExtra)
library(babynames)
library(dplyr)

dat <- babynames %>%
  filter(name %in% c("Alice", "Maude", "Mae")) %>%
  filter(sex=="F")

p5 <- ggplot(dat, aes(x = year, y = n, color = name)) +
  geom_line() +
  scale_color_discrete(limits = c("Maude", "Mae", "Alice")) +
  labs(color = "Name") +
  scale_y_continuous(
    breaks = seq(0, 15000, 1000),
    name = "Number of babies") +
  theme(
    legend.position = c(1, 1),
    legend.justification = c(1, 1),
    legend.background = element_rect(fill = "white", colour = "black"),
    plot.title = element_text(
      size = rel(1.2), lineheight = .9,
      family = "Calibri", face = "bold", colour = "brown"
    )) +
  ggtitle("Name Popularity Through Years")


p6 <- ggplot(dat, aes(x = year, y = n, color = name)) +
  geom_line() +
  scale_color_discrete(limits = c("Maude", "Mae", "Alice")) +
  labs(color = "Name") +
  scale_y_continuous(
    breaks = seq(0, 15000, 1000),
    name = "Number of babies") +
  theme(
    legend.title = element_text(
      family = "Calibri",
      colour = "brown",
      face = "bold",
      size = 12),
    legend.position = c(1, 1),
    legend.justification = c(1, 1),
    legend.background = element_rect(fill = "white", colour = "black"),
    plot.title = element_text(
      size = rel(1.2), lineheight = .9,
      family = "Calibri", face = "bold", colour = "brown"
    )) +
  ggtitle("Name Popularity Through Years")

grid.arrange(p5, p6, nrow = 2)
相关文章
R 中具有多个条件的函数向量化
发布时间:2023/03/21 浏览次数:72 分类:编程语言
-
一项常见的数据分析任务是根据同一行的其他列使用一个或多个条件创建或更新数据框列。 如果我们尝试使用 if 语句来执行此操作,则只会使用第一行来测试条件,并且会根据该行更
在 R 中读取 xlsx 文件
发布时间:2023/03/21 浏览次数:198 分类:编程语言
-
在这篇文章中,你将会了解到两个在 R 中读取 xlsx 文件的最完整和最容易使用的库:readxl 和 openxlsx。

