如何保存与 Matplotlib 中显示的图形相同的图
在使用 matplotlib.pyplot.savefig() 保存图时,我们有一个名为 dpi 的参数,它指定了文字的相对大小和线条上的笔画宽度。默认情况下,matplotlib.pyplot.show() 的 dpi 值是 80,而 matplotlib.pyplot.savefig() 的 dpi 默认值是 100。
为了确保 show() 和 savefig() 方法的图看起来是一样的,我们必须在 savefig() 方法中使用 dpi=fig.dpi。我们也可以在 matplotlib.pyplot.fig() 方法中设置 figsize 参数来调整图的绝对尺寸,使两个图的尺寸相同。
在 savefig() 方法中设置 dpi=fig.dpi,可以保存与 Matplotlib 中显示的图形相同的图形
import matplotlib.pyplot as plt

x=[1,3,4,5,8]
y=[3,1,5,4,9]

fig = plt.figure()
plt.plot(x, y)
plt.xlabel("X")
plt.ylabel("Y")
plt.title("X vs Y")
fig.savefig('plot.png',dpi=fig.dpi)
plt.show()
输出:

保存的图形:
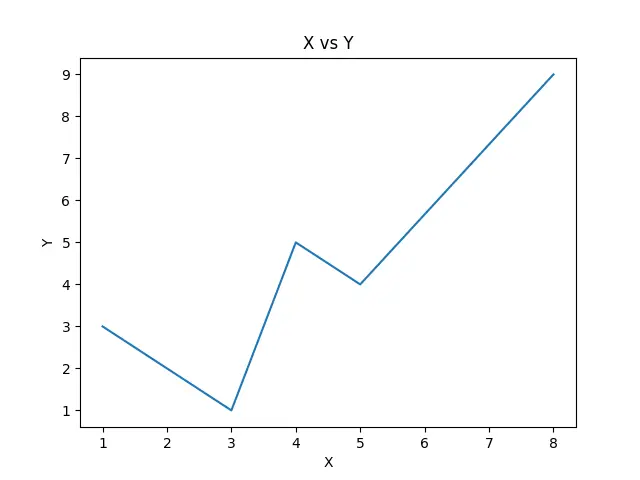
这个过程会将图形保存为 plot.png,与显示的图形相同。
有时,我们可能会在创建的图上得到很大的边框。为了解决这个数值,我们可以使用 matplotlib.pyplot.tight_layout() 方法,或者在 savefig() 方法中设置 bbox_inches='tight'。
import matplotlib.pyplot as plt

x=[1,3,4,5,8]
y=[3,1,5,4,9]

fig = plt.figure()
plt.plot(x, y)
plt.xlabel("X")
plt.ylabel("Y")
plt.title("X vs Y")
fig.savefig('plot.png',dpi=fig.dpi,bbox_inches='tight')
plt.show()
输出:

保存的图形:

相关文章
Pandas DataFrame DataFrame.shift() 函数
发布时间:2024/04/24 浏览次数:133 分类:Python
-
DataFrame.shift() 函数是将 DataFrame 的索引按指定的周期数进行移位。
Python pandas.pivot_table() 函数
发布时间:2024/04/24 浏览次数:82 分类:Python
-
Python Pandas pivot_table()函数通过对数据进行汇总,避免了数据的重复。
Pandas read_csv()函数
发布时间:2024/04/24 浏览次数:254 分类:Python
-
Pandas read_csv()函数将指定的逗号分隔值(csv)文件读取到 DataFrame 中。
Pandas 多列合并
发布时间:2024/04/24 浏览次数:628 分类:Python
-
本教程介绍了如何在 Pandas 中使用 DataFrame.merge()方法合并两个 DataFrames。
Pandas loc vs iloc
发布时间:2024/04/24 浏览次数:837 分类:Python
-
本教程介绍了如何使用 Python 中的 loc 和 iloc 从 Pandas DataFrame 中过滤数据。
在 Python 中将 Pandas 系列的日期时间转换为字符串
发布时间:2024/04/24 浏览次数:894 分类:Python
-
了解如何在 Python 中将 Pandas 系列日期时间转换为字符串

