在 Matplotlib 条形图上添加值标签
Matplotlib 条形图是在 Python 中可视化数据的好方法。在条形图中,我们经常需要添加标签来可视化数据。本文将介绍在 Matplotlib 条形图上添加值标签的各种方法。
使用 pyplot.text() 方法在 Matplotlib 条形图上添加值标签
要在 Matplotlib 条形图上添加值标签,我们可以使用 pyplot.text() 函数。
Matplotlib 模块中的 pyplot.text() 函数用于将文本值添加到图中的任何位置。pyplot.text() 函数的语法如下。
matplotlib.pyplot.text(x, y, s, fontdict=None, **kwargs)
这里,
-
参数
x和y是放置文本的图形坐标。参数s包含文本字符串。 -
参数
fontdict用于更改文本的字体和大小等属性。它的默认值是None。 -
**kwargs参数表示用于确定条形图中文本位置的其他参数。
在本文中,我们将使用参数 ha 来决定文本的水平对齐方式。你可以从 text() 函数的官方文档 中更深入地了解该函数的其他参数。
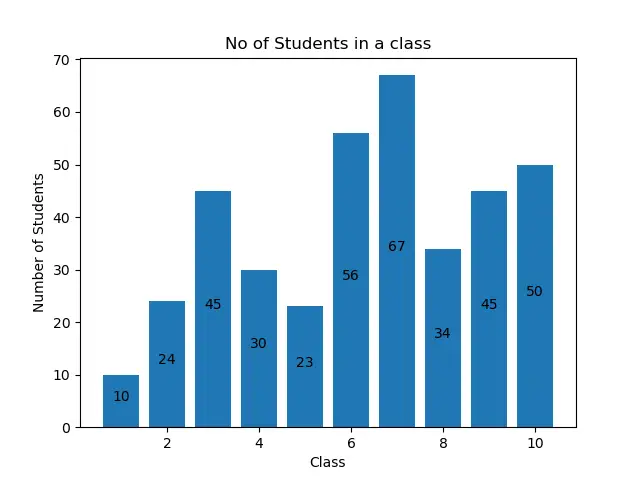
现在让我们绘制一个条形图,然后为其添加值标签。假设我们有一所学校从班级 1 到班级 10 的一个班级的学生人数数据以列表的形式如下。
no_of_students=[10,24,45,30,23,56,67,34,45,50]
这里,索引 i 代表班级 i+1 的学生人数。为了绘制数据,我们将创建一个列表 class_number,其中包含从 1 到 10 的数字。之后,我们将使用 pyplot.bar() 函数绘制条形图。然后,我们将分别使用 title()、xlabel() 和 ylabel() 函数将 title、xlabel 和 ylabel 添加到图中。
为了添加值标签,我们将定义一个函数 add_value_label(x_list,y_list)。这里,x_list 和 y_list 是包含 x 轴和 y 轴数据的列表,即 class_number 和 no_of_students。
在函数 add_value_label() 中,我们将值标签的坐标指定为 (x, the height of the bar chart at x),以便将值标签添加到条形图的顶部。传递给 text 函数的文本值将是条形图在 x 处的高度。此处,x 将是 class_number 的元素,而 the height of bar chart at x 将是班级 x 中相应的学生人数。
例如,我们将每个班级的学生人数作为值标签添加到条形图的顶部。
import matplotlib.pyplot as plt

def add_value_label(x_list,y_list):
    for i in range(1, len(x_list)+1):
        plt.text(i,y_list[i-1],y_list[i-1])

no_of_students=[10,24,45,30,23,56,67,34,45,50]
class_number=[1,2,3,4,5,6,7,8,9,10]
plt.bar(class_number,no_of_students)
add_value_label(class_number,no_of_students)
plt.title("No of Students in a class")
plt.xlabel("Class")
plt.ylabel("Number of Students")
plt.show()
输出:

你可能会观察到值标签不在输出条形图顶部的中心。我们可以通过操作输入参数来做到这一点,如以下部分所述。
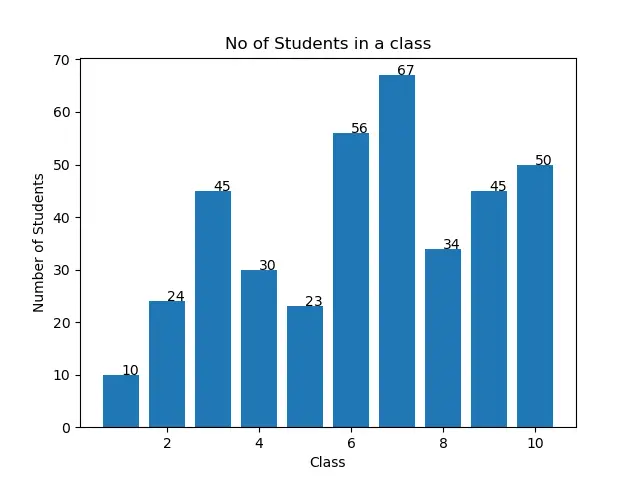
在每个条形图的中心在 Matplotlib 条形图上添加值标签
要在条形图顶部中心的 Matplotlib 条形图上添加值标签,我们将在 pyplot.text() 函数中指定水平对齐方式为 center,如下所示。
import matplotlib.pyplot as plt

def add_value_label(x_list,y_list):
    for i in range(1, len(x_list)+1):
        plt.text(i,y_list[i-1],y_list[i-1], ha="center")

no_of_students=[10,24,45,30,23,56,67,34,45,50]
class_number=[1,2,3,4,5,6,7,8,9,10]
plt.bar(class_number,no_of_students )
add_value_label(class_number,no_of_students)
plt.title("No of Students in a class")
plt.xlabel("Class")
plt.ylabel("Number of Students")
plt.show()
输出:

在每个条形高度中间的 Matplotlib 条形图上添加值标签
你还可以在每个条形高度的中间添加值标签。为此,我们必须在 pyplot.text() 函数中将 y 坐标指定为 (x 处条形图的高度)/2。你可以在以下示例代码中看到这一点。
import matplotlib.pyplot as plt

def add_value_label(x_list,y_list):
    for i in range(1, len(x_list)+1):
        plt.text(i,y_list[i-1]/2,y_list[i-1], ha="center")

no_of_students=[10,24,45,30,23,56,67,34,45,50]
class_number=[1,2,3,4,5,6,7,8,9,10]
plt.bar(class_number,no_of_students )
add_value_label(class_number,no_of_students)
plt.title("No of Students in a class")
plt.xlabel("Class")
plt.ylabel("Number of Students")
plt.show()
输出:
使用 pyplot.annotate() 函数在 Matplotlib 条形图上添加值标签
除了 pyplot.text() 函数,我们可以使用 pyplot.annotate() 函数在 matplotlib 条形图上添加值标签。pyplot.annotate() 函数的语法如下。
matplotlib.pyplot.annotate(text, xy, *args, **kwargs)
这里,
-
参数
text是将添加到图表中的标签。 -
参数
xy接受一个元组(x,y),其中x和y是将标签添加到图形的坐标。 -
该函数接受许多不同的参数。本文将仅使用参数
ha来设置条形图中标签的水平对齐方式。
我们将使用 pyplot.bar() 函数绘制条形图。然后,我们将分别使用 title()、xlabel() 和 ylabel() 函数将 title、xlablel 和 ylabel 添加到图中。
为了在 Matplotlib 条形图上添加值标签,我们将定义一个函数 add_value_label(x_list,y_list)。这里,x 和 y 是包含 x 轴和 y 轴数据的列表。在函数 add_value_label() 中,我们将根据为 x 和 y 坐标提供的数据创建的元组作为输入参数传递给参数 xy。有了这个,我们将其他值传递给 annotate() 函数,以在 Matplotlib 条形图上添加值标签,如下所示。
import matplotlib.pyplot as plt

def add_value_label(x_list,y_list):
    for i in range(1, len(x_list)+1):
        plt.annotate(y_list[i-1],(i,y_list[i-1]))

no_of_students=[10,24,45,30,23,56,67,34,45,50]
class_number=[1,2,3,4,5,6,7,8,9,10]
plt.bar(class_number,no_of_students )
add_value_label(class_number,no_of_students)
plt.title("No of Students in a class")
plt.xlabel("Class")
plt.ylabel("Number of Students")
plt.show()
输出:
同样,你可以观察到标签未与条形图对齐。要对齐它们,你可以使用水平对齐参数 ha 设置以下对齐方式。
import matplotlib.pyplot as plt

def add_value_label(x_list,y_list):
    for i in range(1, len(x_list)+1):
        plt.annotate(y_list[i-1],(i,y_list[i-1]),ha="center")

no_of_students=[10,24,45,30,23,56,67,34,45,50]
class_number=[1,2,3,4,5,6,7,8,9,10]
plt.bar(class_number,no_of_students )
add_value_label(class_number,no_of_students)
plt.title("No of Students in a class")
plt.xlabel("Class")
plt.ylabel("Number of Students")
plt.show()
输出:

你还可以在每个条形高度的中间添加值标签。为此,我们必须将元组中的 y 坐标指定为 (x 处条形图的高度)/2。你可以在以下示例代码中看到这一点。
import matplotlib.pyplot as plt

def add_value_label(x_list,y_list):
    for i in range(1, len(x_list)+1):
        plt.annotate(y_list[i-1],(i,y_list[i-1]/2),ha="center")

no_of_students=[10,24,45,30,23,56,67,34,45,50]
class_number=[1,2,3,4,5,6,7,8,9,10]
plt.bar(class_number,no_of_students )
add_value_label(class_number,no_of_students)
plt.title("No of Students in a class")
plt.xlabel("Class")
plt.ylabel("Number of Students")
plt.show()
输出:

结论
本文讨论了使用 text() 函数和 annotate() 函数在 Matplotlib 条形图上添加值标签的两种方法。我们还看到了如何通过更改参数来决定标签的对齐方式和位置。你可以根据自己的方便使用任何讨论过的方法在 Matplotlib 条形图上添加值标签。
相关文章
Pandas DataFrame DataFrame.shift() 函数
发布时间:2024/04/24 浏览次数:133 分类:Python
-
DataFrame.shift() 函数是将 DataFrame 的索引按指定的周期数进行移位。
Python pandas.pivot_table() 函数
发布时间:2024/04/24 浏览次数:82 分类:Python
-
Python Pandas pivot_table()函数通过对数据进行汇总,避免了数据的重复。
Pandas read_csv()函数
发布时间:2024/04/24 浏览次数:254 分类:Python
-
Pandas read_csv()函数将指定的逗号分隔值(csv)文件读取到 DataFrame 中。
Pandas 多列合并
发布时间:2024/04/24 浏览次数:628 分类:Python
-
本教程介绍了如何在 Pandas 中使用 DataFrame.merge()方法合并两个 DataFrames。
Pandas loc vs iloc
发布时间:2024/04/24 浏览次数:837 分类:Python
-
本教程介绍了如何使用 Python 中的 loc 和 iloc 从 Pandas DataFrame 中过滤数据。
在 Python 中将 Pandas 系列的日期时间转换为字符串
发布时间:2024/04/24 浏览次数:894 分类:Python
-
了解如何在 Python 中将 Pandas 系列日期时间转换为字符串

