Overlay Bar Charts in Matplotlib
We use the add method in Matplotlib matplotlib.pyplot.bar()to generate a bar chart. To stack a bar chart of one dataset on top of another, we add up all the datasets that need to be stacked and bottompass the sum as the argument to bar()the add method.
import matplotlib.pyplot as plt

data1 = [30, 20, 10, 0, 0]
data2 = [20, 20, 20, 20, 0]
data3 = [50, 60, 70, 80, 100]

year = ["2015", "2016", "2017", "2018", "2019"]

fig, ax = plt.subplots(3, 1, figsize=(10, 8))

ax[0].bar(year, data1, color="red")
ax[0].legend(["C++"])
ax[1].bar(year, data2, color="yellow")
ax[1].legend(["JavaScript"])
ax[2].bar(year, data3, color="green")
ax[2].legend(["Python"])

plt.show()
Output:
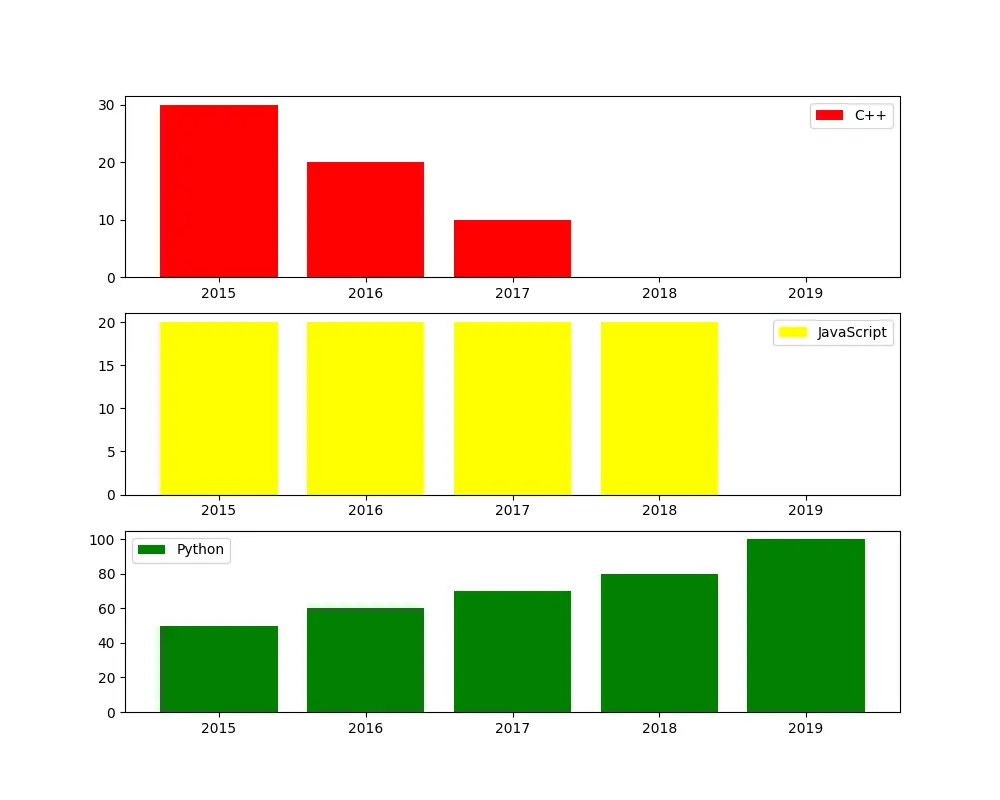
Here we have three separate bar graphs representing the preferences of employees at a company for a programming language over five years. We will discuss how to overlay a bar graph for one language on top of another and use a single bar graph to examine the overall choice of programming languages over the years.
Overlay bar charts Matplotlib
import numpy as np
import matplotlib.pyplot as plt

data1 = [30, 20, 10, 0, 0]
data2 = [20, 20, 20, 20, 0]
data3 = [50, 60, 70, 80, 100]

year = ["2015", "2016", "2017", "2018", "2019"]

plt.figure(figsize=(9, 7))
plt.bar(year, data3, color="green", label="Python")
plt.bar(year, data2, color="yellow", bottom=np.array(data3), label="JavaScript")
plt.bar(year, data1, color="red", bottom=np.array(data3) + np.array(data2), label="C++")

plt.legend(loc="lower left", bbox_to_anchor=(0.8, 1.0))
plt.show()
Output:
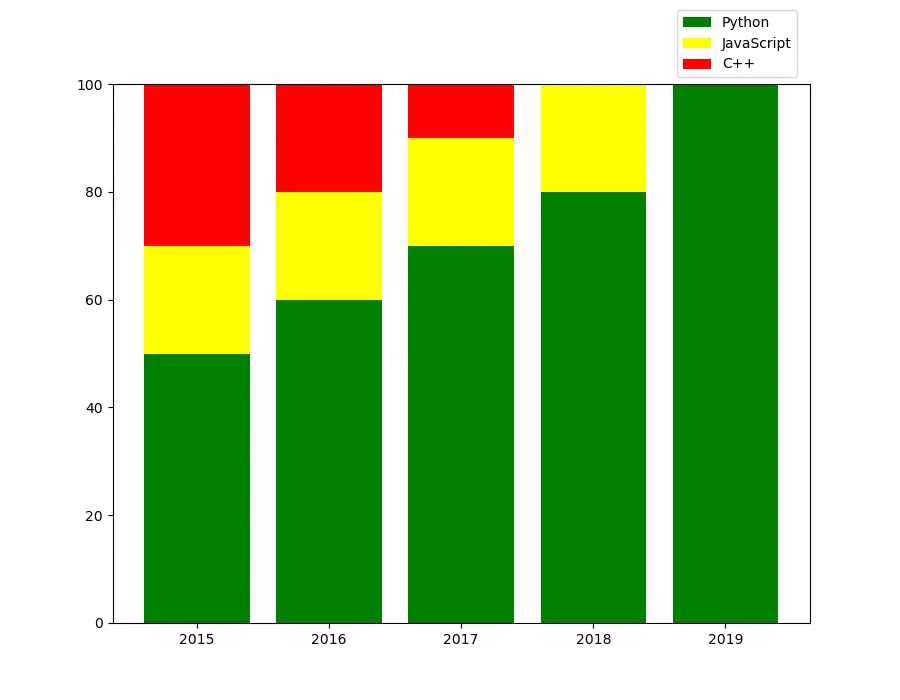
It superimposes one bar chart on top of another. In the figure, we first data3plot as Python data as the basis for the other bar charts, and then plot data2a bar chart of , using data3the bar chart of as data2the basis for the bar chart of . To data2superimpose the bar chart of on data3top of , we set bottom=np.array(data3).
Similarly, data1when we draw the bar chart of , we build on the bar charts of data2and data3. To do this, we data1set when we draw the bar chart of bottom=np.array(data3)+np.array(data2).
Note that we have to use NumPyan array to add bottomthe data for the parameter. If we set it bottom=data3+data2, it will create a list by data3appending the elements of at the end of the list.data2
If we don't want to use NumPyan array, we can use list comprehension to add the corresponding elements of list.
import numpy as np
import matplotlib.pyplot as plt

data1 = [30, 20, 10, 0, 0]
data2 = [20, 20, 20, 20, 0]
data3 = [50, 60, 70, 80, 100]

year = ["2015", "2016", "2017", "2018", "2019"]

plt.figure(figsize=(9, 7))
plt.bar(year, data3, color="green", label="Python")
plt.bar(year, data2, color="yellow", bottom=data3, label="JavaScript")
plt.bar(
    year,
    data1,
    color="red",
    bottom=[sum(data) for data in zip(data2, data3)],
    label="C++",
)

plt.legend(loc="lower left", bbox_to_anchor=(0.8, 1.0))
plt.show()
Output:

How to Overlay Bar Charts Using Matplotlib with Pandasd
We can also Pandasgenerate stacked bar charts in Python using the library in Python.
import pandas as pd
import matplotlib.pyplot as plt

years = ["2015", "2016", "2017", "2018", "2019"]
data = {
    "Python": [50, 60, 70, 80, 100],
    "JavaScript": [20, 20, 20, 20, 0],
    "C++": [30, 20, 10, 0, 0],
}

df = pd.DataFrame(data, index=years)

df.plot(kind="bar", stacked=True, figsize=(10, 8))
plt.legend(loc="lower left", bbox_to_anchor=(0.8, 1.0))
plt.show()
Output:
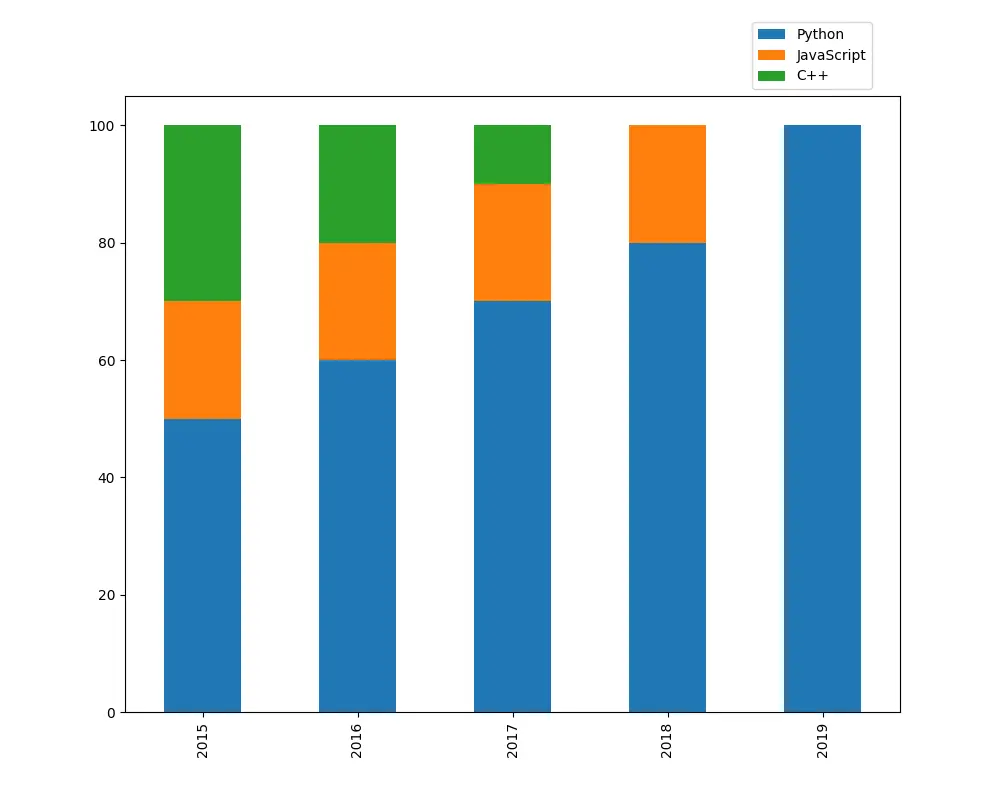
It generates a stacked bar chart from a Pandas DataFrame where the bars of one column are stacked on top of another column for each index in the DataFrame.
For reprinting, please send an email to 1244347461@qq.com for approval. After obtaining the author's consent, kindly include the source as a link.
Related Articles
Enumerating a dictionary in Python
Publish Date:2025/05/05 Views:98 Category:Python
-
The function in Python enumerate() returns an object of enumeration type and adds a counter variable to iterate over a list or other type of collection. It makes looping over such objects easier. When we pass an enumeration object to list()
Changing dictionary values in Python
Publish Date:2025/05/05 Views:108 Category:Python
-
This tutorial will discuss various ways to change the value of a particular key in Python dictionary. We can do this by using the following methods. dict.update() method for cycle. Dictionary Unpacking dict.update() How to change dictionary
Finding the maximum value in a Python dictionary
Publish Date:2025/05/05 Views:60 Category:Python
-
This tutorial explains how to get a key with the maximum value in Python. Since the method has changed from the previous Python versions, it also lists some sample codes to clarify the concepts. Use operator.itemgetter() the method to get t
How to read input from stdin in Python
Publish Date:2025/05/05 Views:124 Category:Python
-
This tutorial discussed stdin the methods of reading input from in Python. You can read directly from the console or from a file name specified in the console. In Python, fileinput.input() use stdin fileinput We can use the read module in P
Maximum integer in Python
Publish Date:2025/05/05 Views:55 Category:Python
-
This tutorial will discuss the maximum integer value in different versions of Python and how we can get it. In Python 2, integers and long integers are different data types. The maximum value of an integer is 2 31 -1. If the value exceeds t
Get a list of time zones using Python
Publish Date:2025/05/05 Views:107 Category:Python
-
When developing real-world applications, software developers must ensure that the application can support users from both their own country and other parts of the world. Since most countries have different time zones and many people around
Convert NumPy array to list in Python
Publish Date:2025/05/05 Views:101 Category:Python
-
Lists and arrays are the two most basic and commonly used collection objects in Python. They are both mutable and are used to store a collection of elements under a common name and each element has a specific location that can be used to ac
Appending 2D Arrays in Python
Publish Date:2025/05/05 Views:64 Category:Python
-
In Python, we can have ND arrays. We can use NumPy module to process arrays in Python. This tutorial demonstrated the different methods you can use to append values to a two-dimensional array in Python. Use append() the function to ap
Sliding average of NumPy arrays in Python
Publish Date:2025/05/05 Views:190 Category:Python
-
The sliding average is often used to study time series data by calculating the average of data at a specific time interval. It is used to eliminate some short-term fluctuations and study data trends. When studying stock price trends, the si

