Setting Matplotlib grid spacing
This tutorial will show you how we can set the grid spacing in a Matplotlib plot and apply different styles to the major and minor grids.
We have to use matplotlib.pyplot.grid()the function to display the grid.
import matplotlib.pyplot as plt

plt.figure(figsize=(8, 6))
plt.xlim(0, 10)
plt.ylim(0, 10)
plt.grid()
plt.title("Plot with Grids")
plt.show()
Output:
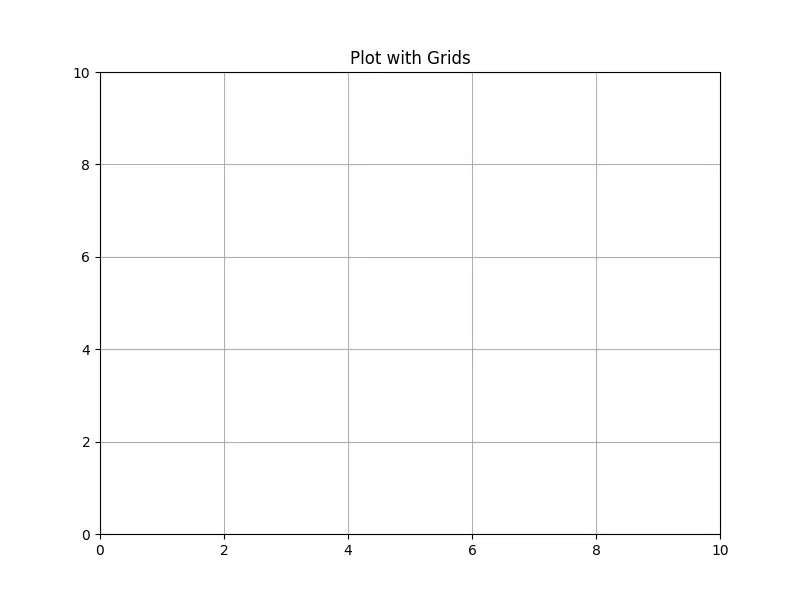
It shows a graph with a grid, where the grid spacing is based on the tick spacing. We can tickschange the grid spacing by changing the tick spacing.
ticksChange the Matplotlib plot grid spacing
by changing the spacing of
import matplotlib.pyplot as plt

fig, axes = plt.subplots(nrows=2, ncols=1, figsize=(8, 6))

axes[0].set_xlim(0, 10)
axes[0].set_ylim(0, 10)
axes[0].set_title("Subplot 1")
axes[0].grid()

axes[1].set_xlim(0, 8)
axes[1].set_ylim(0, 8)
axes[1].set_title("Subplot 2")
axes[1].grid()

plt.show()
Output:
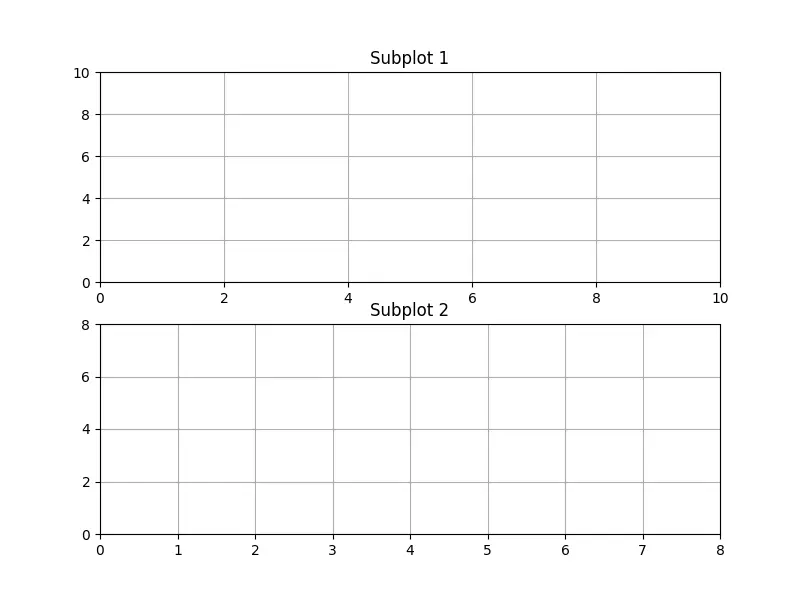
It creates a figure with two subplots. We set different tick spacing for the two subplots. It can be clearly seen from the figure that the grid spacing is ticksmaintained according to the spacing of .
import numpy as np
import matplotlib.pyplot as plt

fig, axes = plt.subplots(nrows=2, ncols=1, figsize=(8, 6))

major_ticks_top = np.linspace(0, 20, 6)
minor_ticks_top = np.linspace(0, 20, 21)

major_ticks_bottom = np.linspace(0, 15, 6)

axes[0].set_xticks(major_ticks_top)
axes[0].set_yticks(major_ticks_top)
axes[0].set_xticks(minor_ticks_top, minor=True)
axes[0].set_yticks(minor_ticks_top, minor=True)
axes[0].set_title("Subplot 1")
axes[0].grid(which="major", alpha=0.6)
axes[0].grid(which="minor", alpha=0.3)

axes[1].set_xticks(major_ticks_bottom)
axes[1].set_yticks(major_ticks_bottom)
axes[1].set_title("Subplot 2")
axes[1].grid()

plt.tight_layout()
plt.show()
Output:
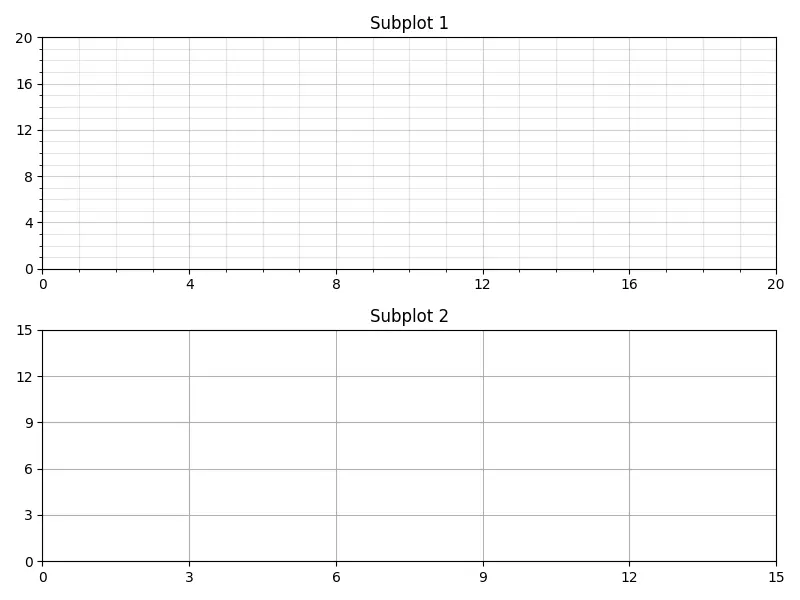
It shows a Matplotlib figure with two subplots. Subplot 1The subplot on top has a small grid and a large grid. The small grid has a spacing of 1 unit and is represented by dark lines. Similarly, the location of the major grid, with a spacing of 5 units, is represented by lighter lines.
We use to represent small ticks in the set_yticks()or functions. We use to select the grid corresponding to ticks and use to select the grid corresponding to ticks.set_xticks()minor=Truewhich="major"majorwhich="major"minor
grid()The parameter in the method alphais used to set the intensity of the grid lines. alphaThe larger the value, the darker the grid lines.
For reprinting, please send an email to 1244347461@qq.com for approval. After obtaining the author's consent, kindly include the source as a link.
Related Articles
Enumerating a dictionary in Python
Publish Date:2025/05/05 Views:98 Category:Python
-
The function in Python enumerate() returns an object of enumeration type and adds a counter variable to iterate over a list or other type of collection. It makes looping over such objects easier. When we pass an enumeration object to list()
Changing dictionary values in Python
Publish Date:2025/05/05 Views:108 Category:Python
-
This tutorial will discuss various ways to change the value of a particular key in Python dictionary. We can do this by using the following methods. dict.update() method for cycle. Dictionary Unpacking dict.update() How to change dictionary
Finding the maximum value in a Python dictionary
Publish Date:2025/05/05 Views:60 Category:Python
-
This tutorial explains how to get a key with the maximum value in Python. Since the method has changed from the previous Python versions, it also lists some sample codes to clarify the concepts. Use operator.itemgetter() the method to get t
How to read input from stdin in Python
Publish Date:2025/05/05 Views:124 Category:Python
-
This tutorial discussed stdin the methods of reading input from in Python. You can read directly from the console or from a file name specified in the console. In Python, fileinput.input() use stdin fileinput We can use the read module in P
Maximum integer in Python
Publish Date:2025/05/05 Views:55 Category:Python
-
This tutorial will discuss the maximum integer value in different versions of Python and how we can get it. In Python 2, integers and long integers are different data types. The maximum value of an integer is 2 31 -1. If the value exceeds t
Get a list of time zones using Python
Publish Date:2025/05/05 Views:107 Category:Python
-
When developing real-world applications, software developers must ensure that the application can support users from both their own country and other parts of the world. Since most countries have different time zones and many people around
Convert NumPy array to list in Python
Publish Date:2025/05/05 Views:101 Category:Python
-
Lists and arrays are the two most basic and commonly used collection objects in Python. They are both mutable and are used to store a collection of elements under a common name and each element has a specific location that can be used to ac
Appending 2D Arrays in Python
Publish Date:2025/05/05 Views:64 Category:Python
-
In Python, we can have ND arrays. We can use NumPy module to process arrays in Python. This tutorial demonstrated the different methods you can use to append values to a two-dimensional array in Python. Use append() the function to ap
Sliding average of NumPy arrays in Python
Publish Date:2025/05/05 Views:190 Category:Python
-
The sliding average is often used to study time series data by calculating the average of data at a specific time interval. It is used to eliminate some short-term fluctuations and study data trends. When studying stock price trends, the si

